![[LBNL]](/images/lbnl_new.jpeg)
Berkeley UPC - Unified Parallel C

![[LBNL]](/images/lbnl_new.jpeg)
|
Berkeley UPC - Unified Parallel C |

|
If you do not have TotalView, you can also use a regular C debugger and get partial debugging support. See Attaching a regular C debugger to Berkeley UPC programs for details.
--with-multiconf=+dbg_tv
(if your configure line already includes a --with-multiconf clause, then
append ",+dbg_tv" to the existing value).
upcc -tv foo.upc
The '-tv' flag implicitly turns on '-g', and also ensures that
the executable is instrumented for TotalView support.
TotalView does not currently support pthreaded Berkeley UPC executables: you cannot compile with both '-tv' and '-pthreads'.
Unfortunately, 'upcrun' and TotalView do not yet work together. You must instead use the underlying network spawner for your network type:
mpirun -tv -np COUNT a.out
where COUNT is the number of UPC threads (and thus MPI processes) to
launch.
totalview prun -a -N COUNT a.out
where COUNT is the number of UPC threads to launch. It is also possible
to use the '-n' flag to prun, in addition to or instead of -N:
see the 'prun' man page for how these flags control job layout.

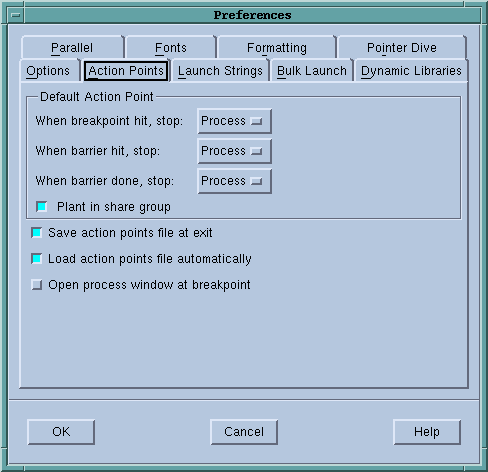
Close the Preferences Window by hitting the OK button. You'll only need to do this the first time you use TotalView as they'll be saved in your TotalView preferences file.
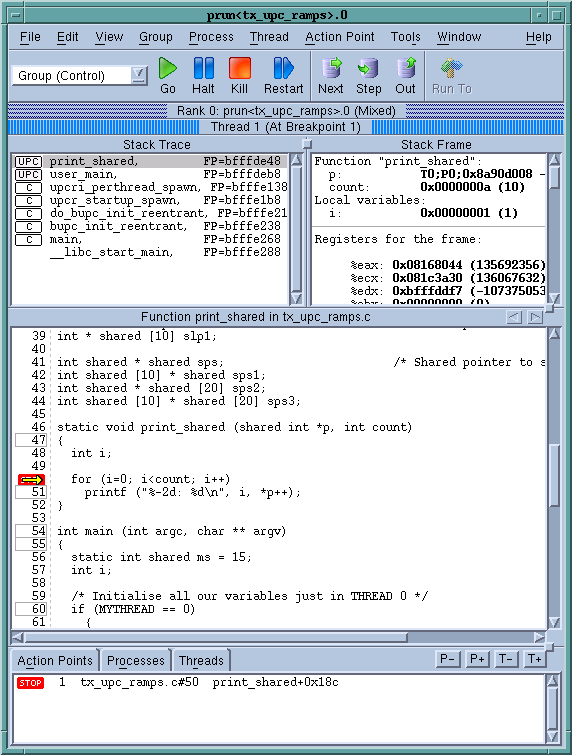
For elan programs, the code for the 'prun' command itself will be shown initially, rather than your UPC code. Hit "Go" to launch 'prun', then attach to the parallel job, and you should see your UPC code, at which time you can select breakpoints and run your UPC code.
Note: Berkeley UPC renames the 'main()' function in UPC code to 'user_main()'. Other function and variable names in your program will keep their exact name within TotalView.

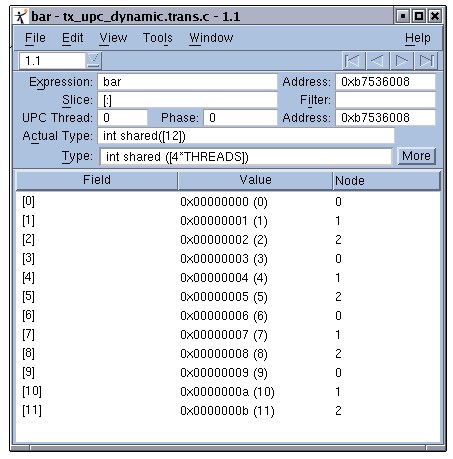
TotalView also has support for understanding 'shared' variables. If you click on (or otherwise "dive" into) a shared variable in your UPC program, you will see that TotalView correctly displays it. Arrays' values are shown, and pointers to shared data show all the logical components of the pointer-to-shared (address, UPC thread, and phase), as well as the value of the data pointed to. Here, for instance, is the display from clicking on 'shared int bar[4*THREADS]' (this is with THREADS=3, and array values set to bar[0]=0, bar[1]=1, etc.):

Note how the correct type for the array is shown, as well as its address, values, and the affinity of each value (in the "Node" field). (Note: to see the "Node" value, right-click within the header area (the area containing Field and Value in the previous figure) and select "Node").
You can switch which UPC thread is displayed in the main TotalView window by hitting the P+ and P- buttons in the bottom right of the window. "Rank 0" will correspond to UPC thread 0, "Rank 1" to thread 1, etc.
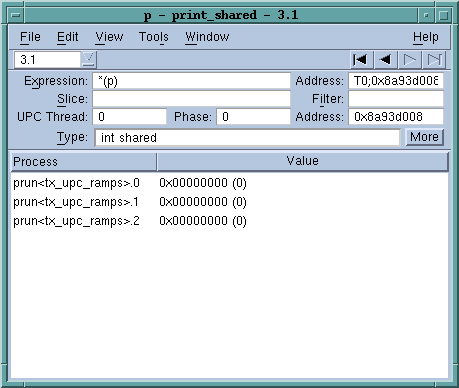
Also, if you are examining a variable that potentially has different values on different UPC threads, you can see all its values by selecting View > Laminate > Process from the menu:

This page last modified on Friday, 28-Oct-2022 15:49:55 PDT