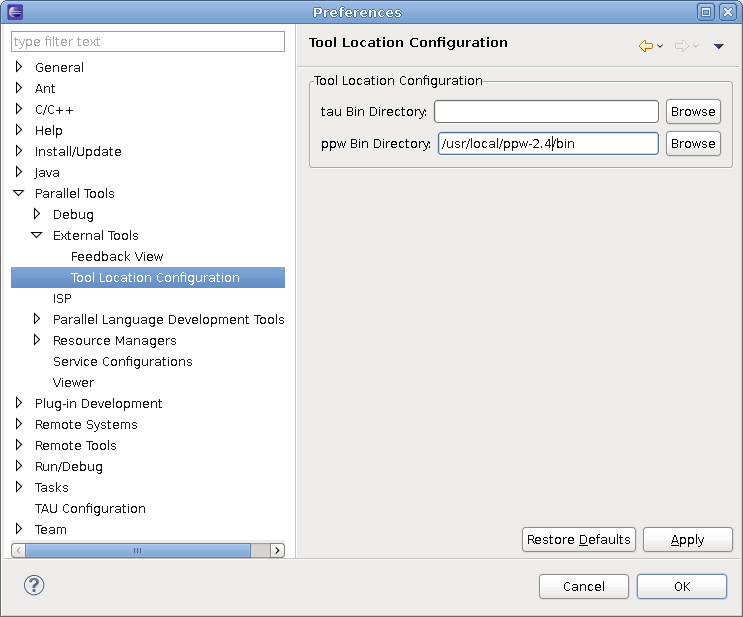
Figure 9.5: Setting the PPW Location
Previous: UPC Project Creation, Up: Eclipse PTP Integration
This section outlines how to use PPW for performance analysis of an application within the Eclipse PTP environment. Starting out with an example UPC project set up in Eclipse, we will show how the PPW plugins give access to PPW's capabilities without leaving the Eclipse IDE.
The first step in using PPW within Eclipse is to specify the PPW installation directory. To do this, select Window > Preferences from the menubar.
Next select Parallel Tools > External Tools > Tool Location Configuration on the left side of the dialog shown in Figure 9.5. Complete the ppw Bin Directory field to specify the ‘bin’ directory within your PPW installation, and then click OK.
We now want to create a profile configuration that will allow us to profile our application using PPW. Just as run configurations can be created to perform a Parallel Application run using PTP (see the Eclipse PTP documentation for more information about this functionality), we create profile configurations to build our application with performance analysis support and then perform parallel runs with instrumentation to collect performance data.
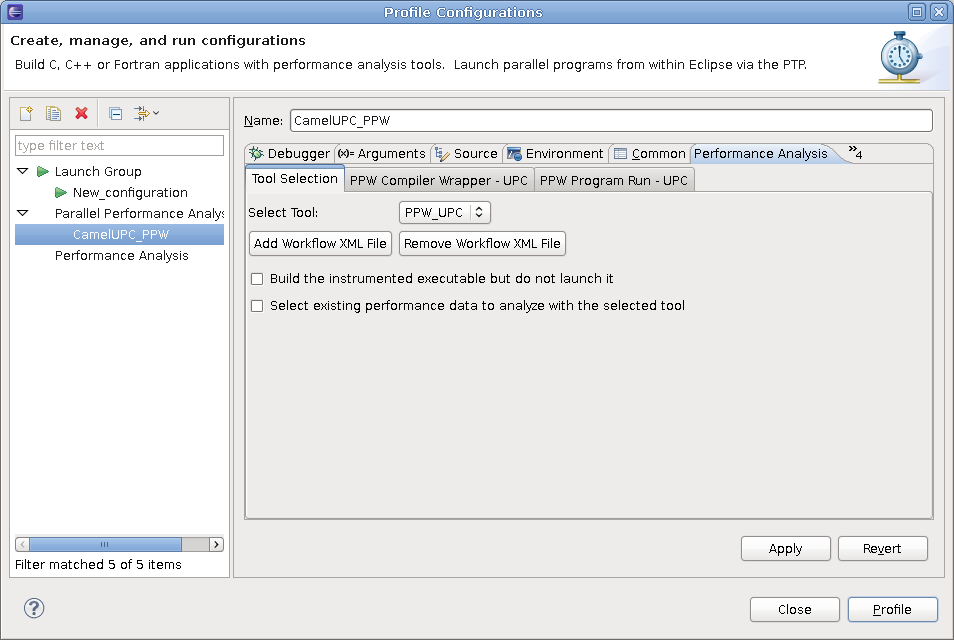
Select Run > Profile Configurations... to begin setting up a profile configuration for your application. On the left side of the dialog, double-click on Parallel Performance Analysis to create a new profile configuration. Many of the fields will be the same as for a corresponding run configuration, but a few important new tabs will be available in the Profile Configurations dialog. Selecting the Performance Analysis tab will allow you to choose from available performance tools and specify performance-analysis-related options.
Within the Tool Selection tab of the Performance Analysis page of the dialog (as seen in Figure 9.6), we now choose PPW_UPC as our tool.
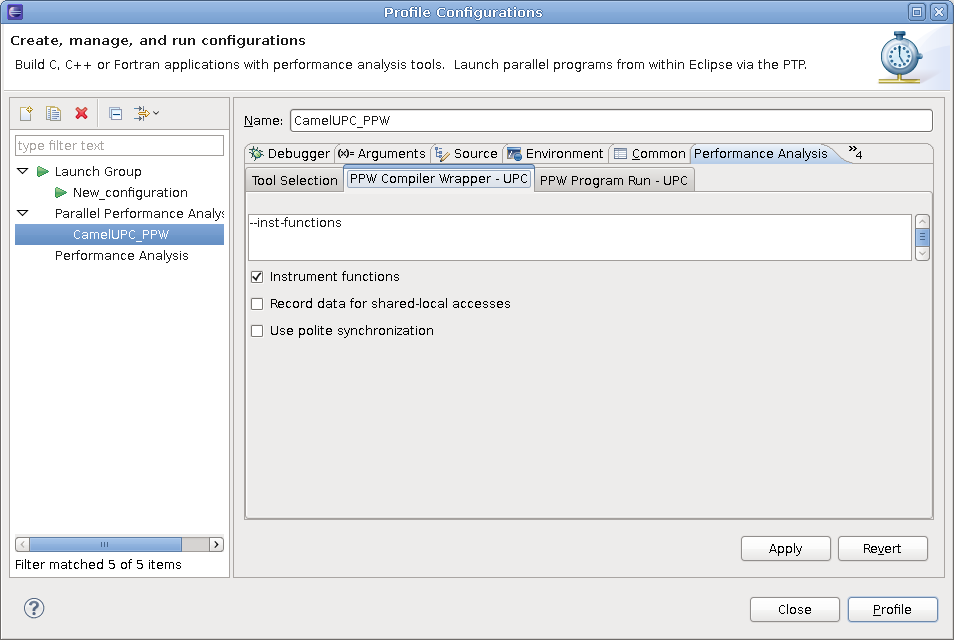
We then proceed to the PPW Compiler Wrapper - UPC tab.
This allows us to specify various options for the PPW compiler wrapper.
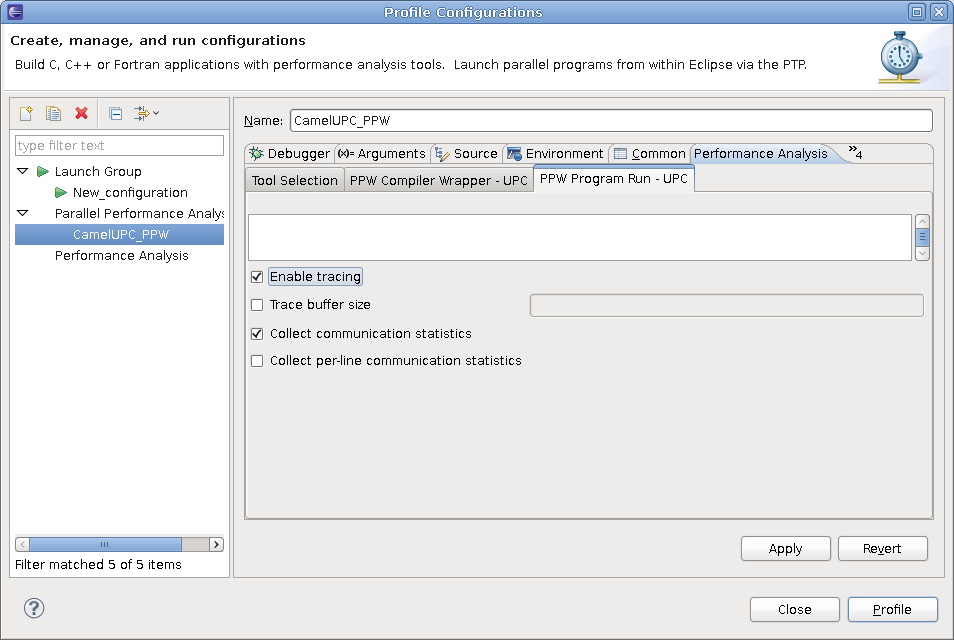
Next we switch to the PPW Program Run - UPC tab.
Here we can specify options for the parallel program run with PPW. Of particular importance are the options to enable tracing and to collect communication statistics.
Once the appropriate options have been specified, we are ready to perform profiling (or tracing). Click on Profile to initiate this process.
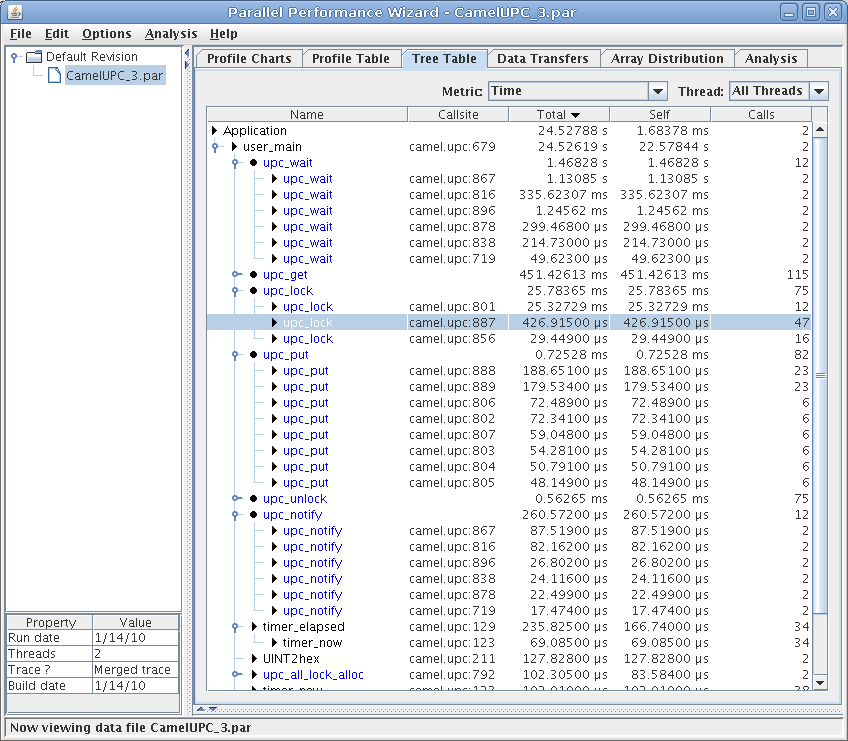
Once the application is built (using appropriate invocations of PPW's compiler wrapper scripts, which should happen automatically), a parallel run (via PTP) will be initiated. This run can be monitored using the PTP Runtime perspective in Eclipse. When the run completes, the resulting PPW performance date (PAR) file will be placed in your project workspace, and the PPW GUI will be directly launched with this file open.
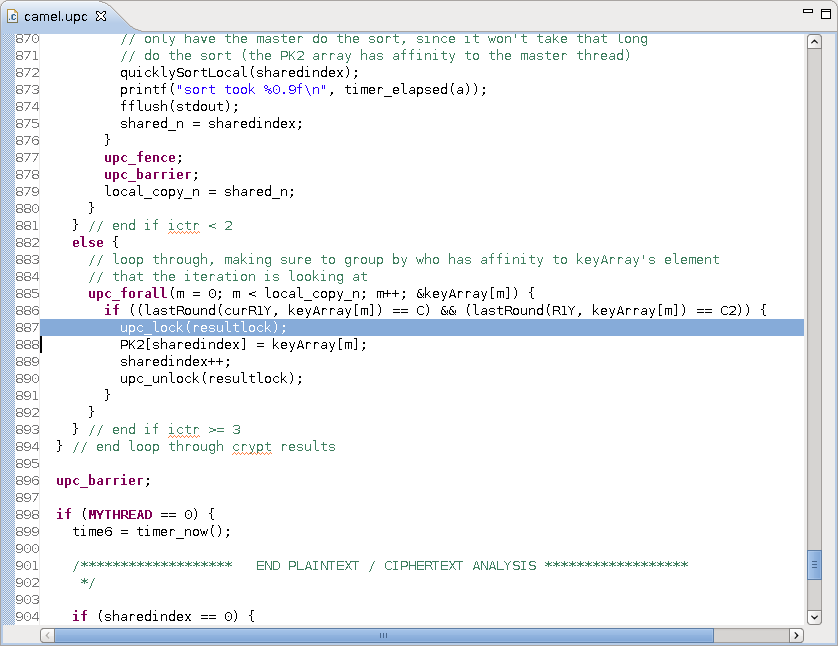
When the PPW GUI is launched from within Eclipse, certain functionality will change to suit the Eclipse environment. Currently the main difference is that when a source code region is selected, as shown in the example in Figure 9.9, the corresponding file will be opened in the Eclipse editor window with the appropriate line highlighted.