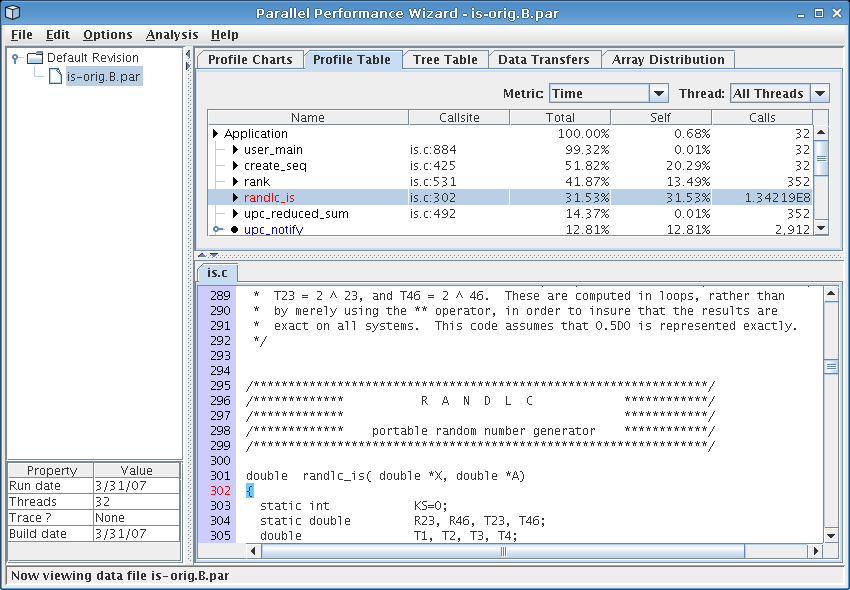
Figure 3.1: Profile table showing rand1c_is function
Next: Analyzing the Profile Data, Previous: The Initial Run, Up: Top
One of the first things we must do when looking at a data file is to determine if the performance data we obtained is accurate and hasn't been adversely affected by the extra operations that PPW performs while tracking performance data. The most foolproof method of doing this is to compare the overall time taken by a profiled run with the time take for a run compiled without using ppwupcc. Another way to do this is to look for any suspicious-looking data using the PPW GUI. For this tutorial, we opt for the second method, using PPW itself to help identify suspect data.
If you were paying attention to the time taken for the run in the previous section, you may have noticed it took a bit longer than a normal run. If we open up that data file and view the profile table visualization (see Figure 3.1), we see something interesting: when we instrumented our program using the --inst-functions flag, we inadvertently captured a ton of calls to the ‘rand1c_is’ function. This function is highlighted in red because PPW thinks that the overhead imposed by tracking each call to this function may have caused it to over-report its influence on overall execution time.
To further check out this function, we un-hide the min and max columns of the table by right-clicking on the table's column headers. When we do this, we see that this function was called about 134 million times, but the total, min, max times show that each individual call took only a few microseconds to execute. Since PPW generally has a fixed amount of work added to each function call, this function was heavily penalized with extra overhead. Ouch!
This ‘rand1c_is’ function is only used in initialization, so we're not really interested in its performance. We could recompile our code without using the --inst-functions flag, but this would mean we'd lose all function-level data, which is too restrictive. Instead, we can make use of some ‘#pragma’s offered by the GASP interface to ask the compiler to avoid instrumenting this particular function. Find the ‘rand1c_is’ function, then add
#pragma pupc off
before the function body definition (somewhere around line 295) and
#pragma pupc on
just after the end of the function (somewhere around line 361). The next time we run our IS benchmark, we will avoid getting performance information for this function, even if we compile with --inst-functions.
Looking for more things to cut out, from Figure 3.1 we see that the ‘create_seq’ function takes up a significant percentage of overall execution time, but is unrelated to the core integer sort algorithm. We need a way for PPW to pretend that time spent executing this particular function never happened in the first place. In other words, we want PPW to subtract out the time spent in this function when displaying performance data. The GASP interface comes to the rescue here again, by providing a simple API for disabling measurement during your program's execution. To do this, we add a special include to the top of the IS source code file is.c:
#include <pupc.h>
Then we add calls to ‘pupc_control’ around the part of the code that calls ‘create_seq’:
     /*  Generate random number sequence and subsequent keys on all procs */
     pupc_control(0);
     create_seq( find_my_seed(
        MYTHREAD,
     	 THREADS,
        4*TOTAL_KEYS,
        314159265.00,      /* Random number gen seed */
        1220703125.00 ),   /* Random number gen mult */
        1220703125.00 );   /* Random number gen mult */
     pupc_control(1);
The next time we run our benchmark, PPW will avoid capturing performance information for the ‘pupc_control’ function, and will subtract out time spent executing that code from the ‘main’ function's totals. You'll probably want to place similar statements around calls to the calls to the ‘full_verify’ function, too.
Keep in mind that while the ‘#pragma’ and ‘pupc_control’ techniques achieve similar results, they perform different functions. The ‘#pragma pupc’s instruct the compiler to avoid instrumenting particular sections of your code, while the ‘pupc_control’ API calls do not affect instrumentation but turn the measurement code on and off at runtime. If you're looking to reduce overhead, use the ‘#pragma pupc’ directives, but if you're looking to ignore parts of your application, use the ‘pupc_control’ API calls.