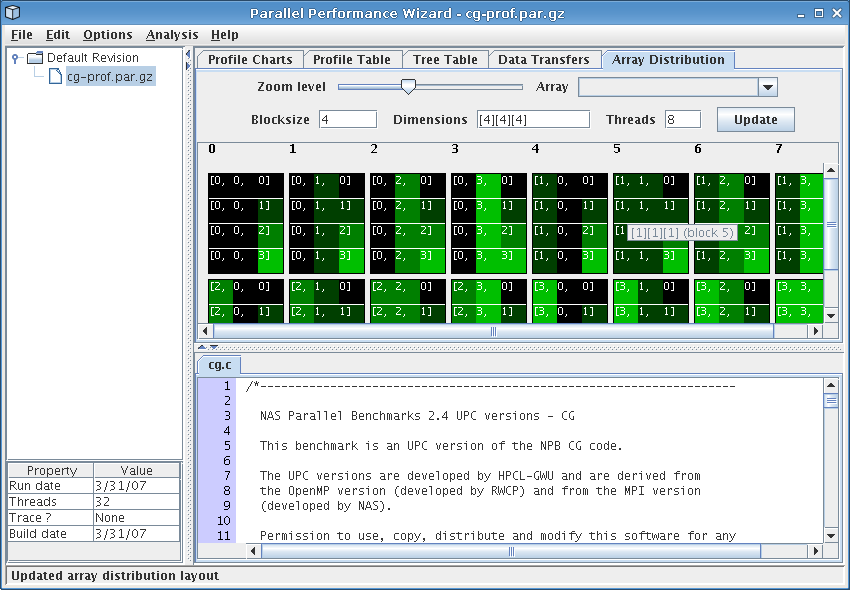
Figure 8.6: Array distribution visualization
Next: Profile Charts, Previous: Data Transfers, Up: Frontend GUI Reference
This visualization shows how each statically-allocated shared array was distributed across threads at runtime, and is only relevant for UPC programs.
See Figure 8.6 for a screenshot of the array distribution visualization.
The Array drop-down box allows you to select an array from the data file of your program. Based on the original declaration of this selected array, the Blocksize and Dimensions fields will be filled in. Additionally, the Threads field is automatically set to the number of threads with which the program was executed. This information is then used to graphically show how the array is distributed among the threads as dictated by the UPC language specification.
In this graphical view, the color of a particular cell is mapped to the array indices of the element that cell represents, with black mapped to 0 and bright green mapped to the maximum value of that array index.
The Blocksize, Dimensions, and Threads fields
can all be modified to allow you to see how a different distribution of
an array would appear. You may use arbitrary expressions involving
THREADS in each of the fields, although remember to put brackets
around each dimenion in the Dimensions field as you would if
you were declaring it in your source code.