Figure 8.5: Data transfers visualization
Next: Array Distribution, Previous: Tree Table, Up: Frontend GUI Reference
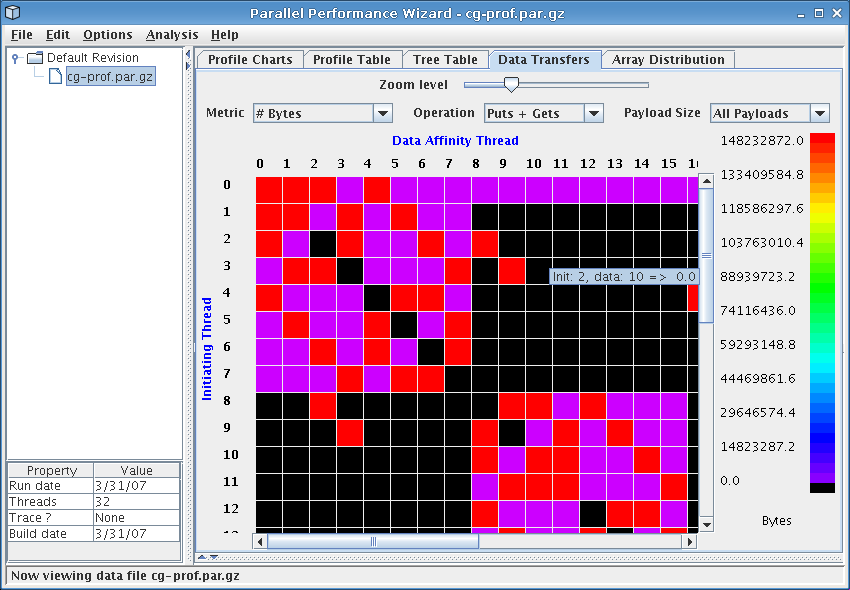
This visualization provides a graphical view of the data transfers that took place during the execution of the user program. Note that in order to view data transfer statistics, you must use ppwrun's --comm-stats option when launching your application.
See Figure 8.5 for a screenshot of the data transfers visualization.
The data-transfer information is shown in a grid, with each cell in the grid containing the data-transfer value of the current metric for a particular initiating thread and data affinity thread. Here the initiating thread is the thread which invoked the data-transfer operation, and the data affinity thread is the thread where the data resided.
The value for a given cell is represented using a color-coding scheme. The legend near the right side of the window shows the mapping between colors and metric values, with the maximum value corresponding to red and the minimum value to purple.
Controls near the top of the window allow you to specify the visualization's content and appearance. The Zoom Level control allows you to adjust the zoom level to increase or decrease the number of cells show on the screen at once.
The Metric drop-down box lets you select from the following data-transfer metrics:
The Operation drop-down box lets you choose whether to show the metric for only ‘Puts’, for only ‘Gets’, or for ‘Puts + Gets’. By default, ‘Puts + Gets’ is selected.
Finally, the Payload Size drop-down box allows you to choose a payload size range for which to show data-transfer data.
The data transfers visualization is helpful in identifying problems associated with the communication pattern in your program. Threads that initiate an inordinate amount of communication will have their corresponding row in the grid stand out in red. Similarly, threads which have affinity to data which is transferred a lot will have their column in the grid stand out.