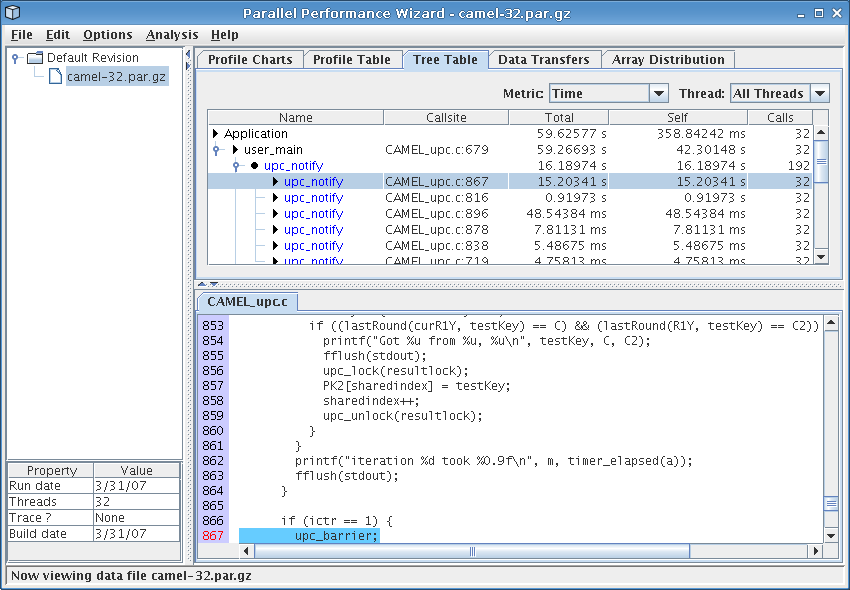
Figure 8.4: Tree table visualization
Next: Data Transfers, Previous: Profile Table, Up: Frontend GUI Reference
The tree table is like the profile table in that it shows a tabular view of profile data. However, instead of just showing a flat list of regions in your program, the tree table shows you performance information in relation to your application's call paths. Related callsites for a region are still grouped together, but only if the callsites occurred within the same call path.
See Figure 8.4 for a screenshot of the tree table visualization.
The tree table visualization has the same display characteristics and behaviors as the profile table, including color coding of regions, double-clicking to view region breakdowns across all nodes, and the ability to hide and show each column. For more information about these features, see Profile Table.