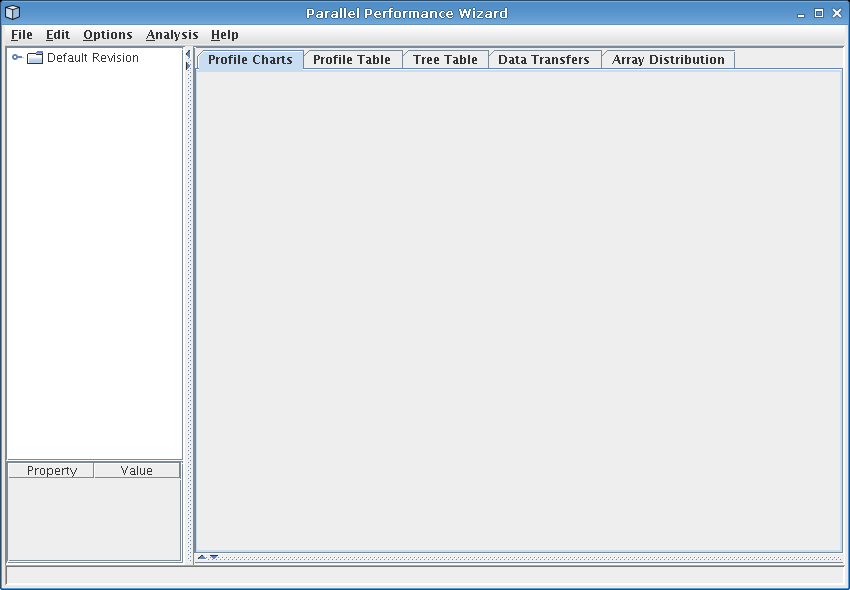
Figure 8.1: Default PPW GUI
Next: Profile Table, Up: Frontend GUI Reference
The GUI provided by PPW allows you to view the performance data obtained during the measurement process.
See Figure 8.1 for a screenshot of this interface as it appears when no data file is loaded.
PPW's user interface is grouped into four main sections: the open file list (upper left), the experiment information panel (lower left), the source panel (lower right, not shown), and the visualization panel (upper right).
The open file list shows all currently-open files. Some visualizations deal with experiment data from more than one run, so PPW allows you to open and browse performance data for more than one data file.
PPW also allows you to organize your data files into revisions, which you can think of as a particular “version” of your program. For instance, you might have two possible methods of runtime load-balancing strategies and you want to use PPW to compare the performance of both strategies side-by-side. In this case, you'd create two revisions, and load up different performance data sets corresponding to different system sizes into each revision. Revisions can also be used to compare the performance of a program across different architectures, communication hardware, etc.
PPW's visualizations are designed to treat data files within a particular revision as data from the same revision run on different number of nodes. If you don't follow this convention when loading in data files, some of the visualizations dealing with more than one data file will show strange results. However, if you are simply using visualizations that display data for a single file only (such as the Tree Table and Data Transfers visualizations) you do not need to load data files in any special way.
To create or modify revisions in the PPW GUI, choose File > New revision..., File > Rename revision..., or File > Close revision... from the menu bar. To load data files into a particular revision, select a revision by clicking on that revision name (ie, click “Default Revision” in Figure 8.1) or left-click on a file within that revision, then choose File > Open... from the menu bar. Additionally, you may right-click on a revision name in the open file list to add files to that revision. Files can also be dragged with the mouse from one revision to another, or dragged from outside the PPW program into the file list and opened in the current revision.
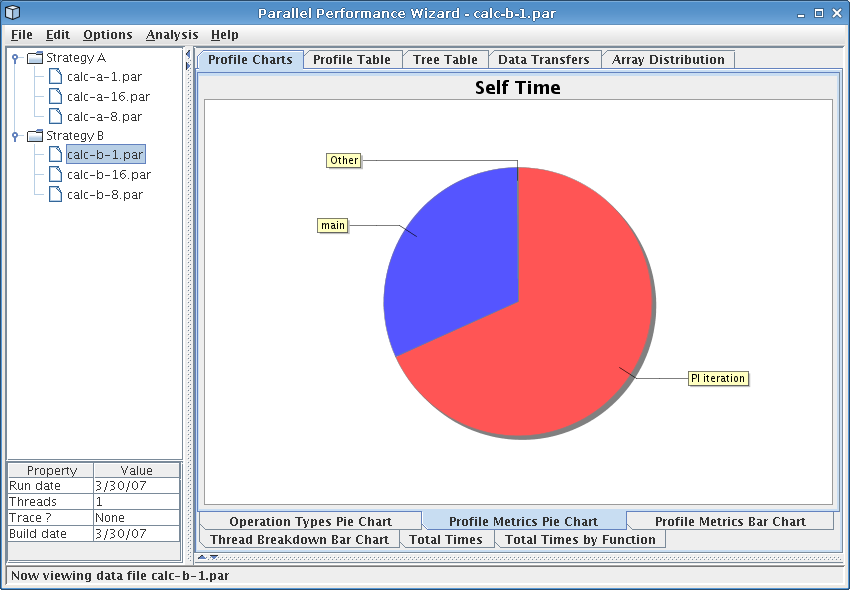
As a concrete example, assume you have two strategies for performing calculating the value of Pi, “Strategy A” and “Strategy B”, and you have data sets for both of these methods with runs of size one, eight, and sixteen nodes. In this case you'd want to create revisions as shown in Figure 8.2.
For complex analyses and programs with many different revisions, it might take a while to set up your revision sets just the way you want them. To save time, PPW allows you to save and restore the current workspace (which includes all revisions and files within those revisions) if you want to come back to the same revision set up later on. To save the current set of loaded files, choose File > Workspace > Save workspace from the menu bar and give your saved file an extension of .pbw. To restore a previously-saved set of loaded files, choose File > Workspace > Load workspace from the menu bar and select a file you have previosly saved.
Note: The workspace files you save use absolute paths, which means they will not work on another machine unless the data files reside in the same location on that machine too.
The information panel in the lower left of the PPW GUI shows basic data about the currently-selected data file, including the date the data was gathered, the number of threads in the run, if the data file contains trace records, and the date the executable for this program was built.
To get more detailed information about a particular data file, choose File > Experiment info from the menu bar. PPW tracks a lot of information about your program, including:
In particular, the “ident” strings for your program's executable will contain a lot of useful (but detailed) information, especially if you use Berekley UPC and/or Quadrics network hardware.
The source panel shows a snapshot of source code that was used to generate the performance data shown by each visualization. If you notice source code files missing from your data set, see the notes section for ppwcc, ppwshmemcc, and ppwupcc.
The visualization panel shows a tabbed interface of available visualizations. To switch to a different visualization, click on the visualization's name in tab list.
Most visualizations will show performance data for the currently-selected file in the open file list. To change the currently-selected file, left-click on a file within the open file list on the left side of the screen. For visualizations that work on a group of files in a single revision, you may change which revision is used to display data by left-clicking on the revision name in the open file list.
The available visualizations are:
Each of these visualizations is discussed in the following sections.